
Market Update (March 2023)
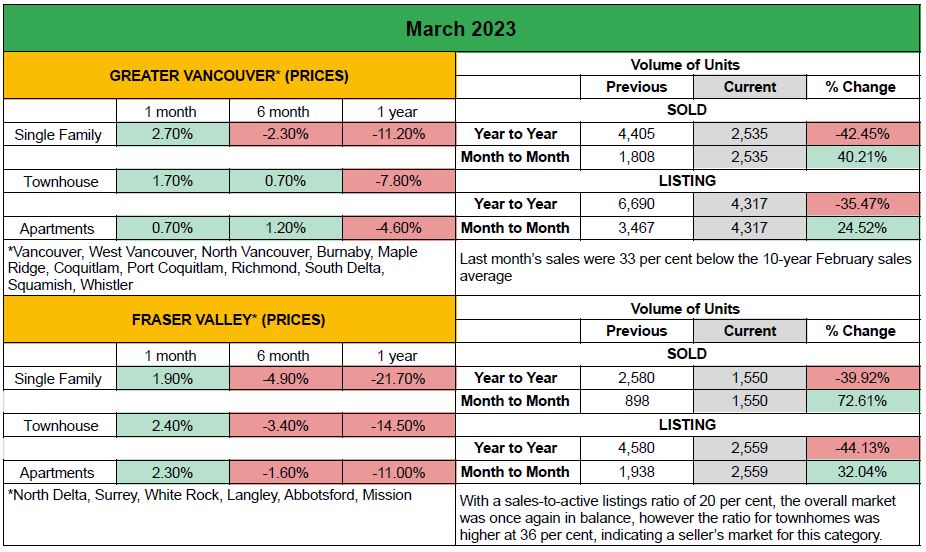
GVA & Fraser Valley: The markets are looking healthier than they have been since last summer. All product types in all areas are up 0.7 to 2.7% month over month but are still mostly down over last 6 to 12 months. Sales volume in the GVA is up 40.21% from February and up 72.61% in the Fraser Valley. These sales increases are necessary for values to equalize and potentially go up this Spring / Summer. Although well below the 10 year average, it shows promise for the health of real estate in BC this Spring.
Check out the following links for more specific areas:
GVA – https://members.rebgv.org/news/REBGV-Stats-Pkg-Mar-2023.pdf
Fraser Valley – https://www.fvreb.bc.ca/statistics/Package202303.pdf
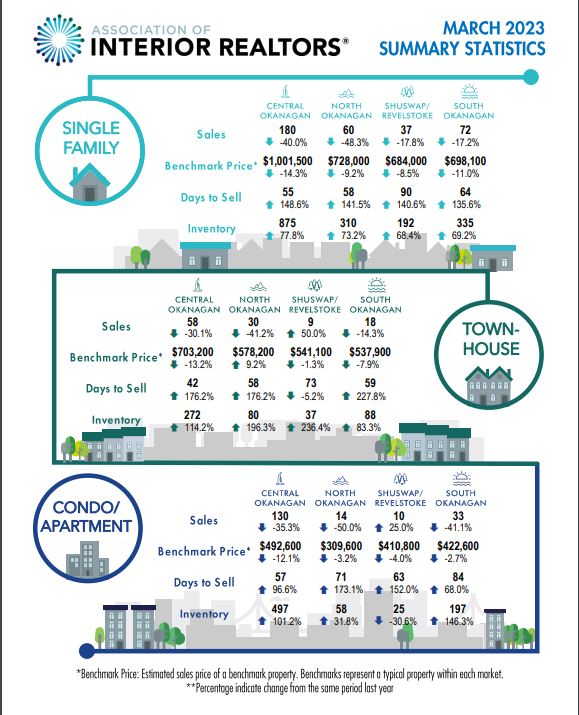
Central Okanagan:
Sales in the Central Okanagan have slowed considerably since this time last year. Single Family home sales are down 40%, townhomes down 30.1% and apartments down 35.3%. The average price of a single family home is down 14.3%, townhomes down 13.2% and apartments down 12.1%. However, it is apparant with the new OCP in full swing, and summer around the corner, the market is Kelowna and surrounding areas is sure to pick up steam after 12 months of descreased sales activity. Here is an inforgraphic with more information.
Sales to Listings Ratios: April 5, 2023 (GVA, Fraser Valley, Okanagan)
The markets are changing, and you want to stay informed with what is happening in your specific lending areas. That’s awesome!
Adlaw Appraisals WEEKLY sales to listing ratio is attached and provides an update for 50 different market areas, for both single family and multi family (townhomes and apartments) in the GVA, Fraser Valley and Okanagan regions. What is a sales to listing ratio? The ratio between the number of homes sold in the last 30 days versus the number of total listings in the market.
Why is it important? It is a point in time indicator of demand and supply of housing in a specific area and provides excellent information for buyer’s, seller’s, realtors and valuation experts who cannot afford to wait 3-4 weeks until monthly stats are available.
Generally speaking, a downward market (buyer’s market) is when the ratio dips below 12 per cent for a sustained period, while home prices often experience upward pressure (seller’s market) when it surpasses 20 per cent over several months.
SUMMARY: It is still a buyer’s market for single family homes in the Fraser Valley and GVA and now Okanagan with a more “balanced” in the Vernon Areas. This has been a consistent theme now for months. With townhomes and apartments, it is a balanced market overall, with Okanagan doing very well in terms of sales to listings. Surrey, Sunshine Coast and West Vancouver all are a shwoing heavy buyer’s market. Burnaby and Coquitlam areas are doing better, and showing a balanced market.
Generally speaking, a downward market (buyer’s market) is when the ratio dips below 12 per cent for a sustained period, while home prices often experience upward pressure (seller’s market) when it surpasses 20 per cent over several months.
SUMMARY: The volume of sales has roughly doubled since February and listings are not picking up at the same rate. Most markets are now in a healhty balanced situation, with some even showing signs of a seller’s market (ahh like the good ol’ days!). Here is a quick summary! (If you want to be mailed my breakdown of each MLS neighbourhood, send an email to info@adlawappraisals.com and say “please add me to weekly stats report”.
Single Family:
Fraser Valley Average = 18.52%
GVA Average = 14.86%
Okanagan = 21.42%
Vernon = 22.16%
Townhomes and Apartments:
Fraser Valley Average = 29.58%
GVA Average = 25.46%
Okanagan = 28.27%
Vernon = 41.41%
If you have questions about the ratios in a specific market or real estate appraisals in general, please contact us today!Need a real estate appraisal? We can help! https://www.adlawappraisals.com/order-appraisal/
Thank you for reading!
Adam Lawrenson, AACI
Owner, Adlaw Appraisals Ltd.