
Adlaw Report – Sales to Listing Ratios for Micro Markets, Real Estate Statistics (August 2022), Months of Inventory and Where are Prices Going?
BONUS: Central Okanagan Apartment Analysis
Sales to Listing Ratios for Micro Markets
You can view the general July statistics for GVA and Fraser Valley on Instagram, Facebook and LinkedIn.
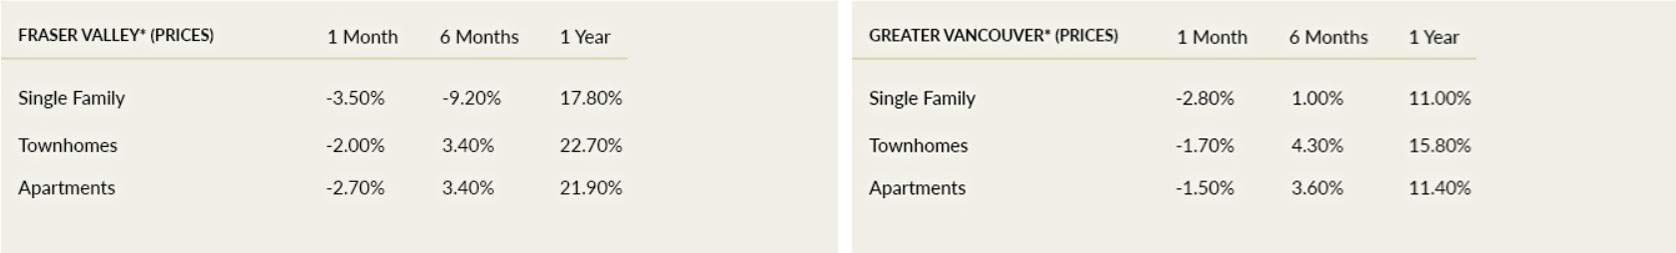
The data shows all property types in all areas are down 1 to 3% in the last month, and closer to 4 to 5% in the last 3 months after years of strong growth.
Today, I want to talk about some micro markets. What I love about these ratios is that you can apply the formula to an infinite amount of markets. You can be broad in scope, which the REBGV provides, or you can dig down to, say, one-bedroom apartment units in Downtown Kelowna, or Downtown Vancouver, specifically, Yaletown one-bedroom units between $500,000 and $800,000. The permutations are limitless. Let’s dig into the definition and application of Sales to Listings Ratios.
The Sales to Listing Ratios are an indicator of demand and supply. It is all the completed sales in the last 30 days divided by the total number of active listings. There is downward pressure on prices when the ratio dips below 12 percent for a sustained period, while home prices often experience upward pressure when it surpasses 20 percent over several months. Check out these micro markets:
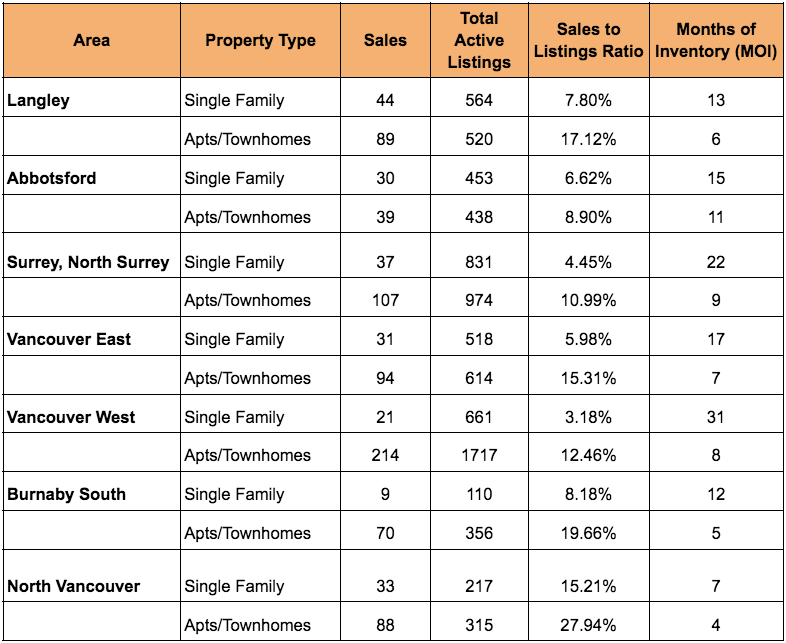
*Statistics based on sales from July 4 to Aug 4, 2022 and active listings as of August 4, 2022.
It is clear that most areas, and property types are below 12% and have been for a few months. This means there is pressure for prices to continue to decrease in the near future. You will see that some markets are in the +/- 15% which means a more balanced market. Two areas which have a very strong buyer’s market are Surrey and Vancouver West Single Family. Seller’s still have some control to maintain a high price point for their apartments and townhomes in the Burnaby South and North Vancouver areas.
Real Estate Statistics – August 2022
Months of Inventory
Months of Inventory (MOI) is the relationship of sales pace to the number of properties currently on the market if no additional homes were added to the supply. It is calculated by determining the number of homes sold per month and dividing by the total number of properties for sale on the last day of the month. When there is more than six months of inventory on the market, there is ample supply for buyers to choose from, so we say it is a buyer’s market. If there is less than six months of inventory, buyers have to compete more for each home, so sellers don’t have to give in to buyer demands as readily. We say this is a seller’s market. At around six months of inventory, we call the market balanced.
It appears that Langley apartments and townhomes are in a perfectly balanced position at exactly 6 months of inventory. Areas of concern are Surrey and Vancouver West Single Family Homes. Being an astute professional, you have probably already observed a strong correlation between the sales to listing ratio and the MOI. These do trend at the same rate. This is just another way to visualize the demand-supply dynamics of different areas and or property types.
Where are Prices Going?
We are in a transition period after years of strong growth in most markets. Nobody has a crystal ball but these two indicators provide excellent data for buyers and sellers to make educated decisions. In addition, it helps us, appraisers, with valuing properties. Typically, appraisers use sales data that can be up to three months old and the statistics we rely on may not be relevant or updated, so having this real-time information can assist the appraiser in determining a current fair market value. The data suggests most markets being a “buyer’s” market which will push downward pressure on prices. It is undetermined how motivated the sellers are, but we can assume many are motivated, for various reasons, and unless things change (interest rates, decreased supply, etc) values will continue to decline. There are definitely opportunities during these times of transition to find properties at below-market prices. For those of you trying to time the market, good luck, and for those who are proactive and opportunity driven..contact your realtor and go make some offers!
BONUS SECTION
Central Okanagan Apartment Analysis
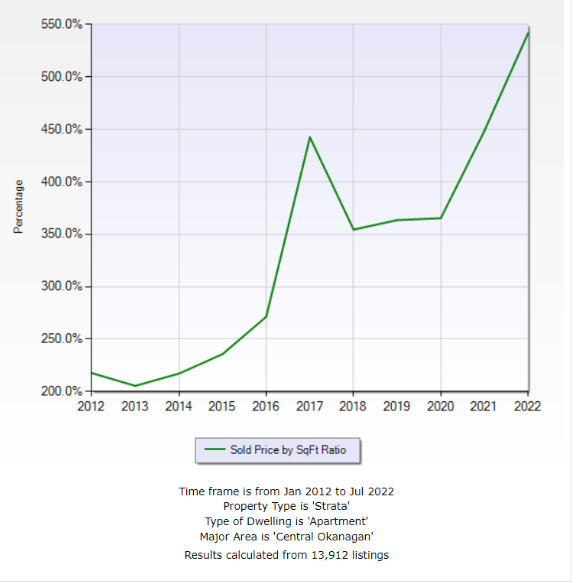
For the Kelowna and West Kelowna brokers out there, here is some interesting data for you to help you motivate your clients to perhaps buy a vacation or rental property. Apartments in the Central Okanagan have increased, on average, 14% per year since July 2012. If we remove some of the new builds, including concrete highrises, the rate decreases to 12% per year. Not bad! How is the apartment situation looking today in Central Okanagan? There were 100 sales in the last 30 days with 447 units currently listed, giving us a sales to listing ratio of 22.4% which means it is still a seller’s market with moderate pressure for prices to increase in the short term. With only 4.47 months of inventory seller, ’s can still keep prices up and force buyers to compete and will encourage multiple offer situations.